If you want to create your own dashboard, the option is in the Dashboards sub-menu, click on Create dashboard and name it whatever you want.
When you create a new dashboard, it is completely empty of data, now the construction begins!
Click "Add Chart" in the top right corner to add a chart.
Here you get different options to be able to create your card:
We'll go through its components below here so we'll get a full picture of what we can and can't do.
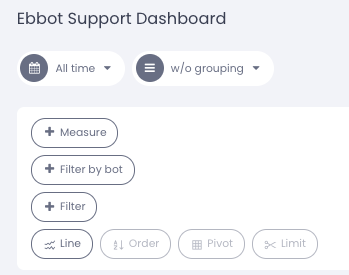
Measure: Here are all the different ways for us to measure data.
Filter by bot: Bot filtering, if you have several bots and only want to measure traffic on one or more of them.
Filter: Different measure cards have different filters at, for example, agent / bot level.
Line: Selects how we want to present the data.
Order: Sort your data by ascending/descending in a table
Pivot: Choose whether your data should be on the x or y axis
Limit: Set a limit on your data.